Contributing Area of Gauging Station
A gauging station measures the flow of a river. However, to understand the flow dynamics, we need to determine the basin area contributing to each gauging station. This tool allows us to calculate the area upstream each gauging station, which we will use in a later step of the plugin (Fig. 7).
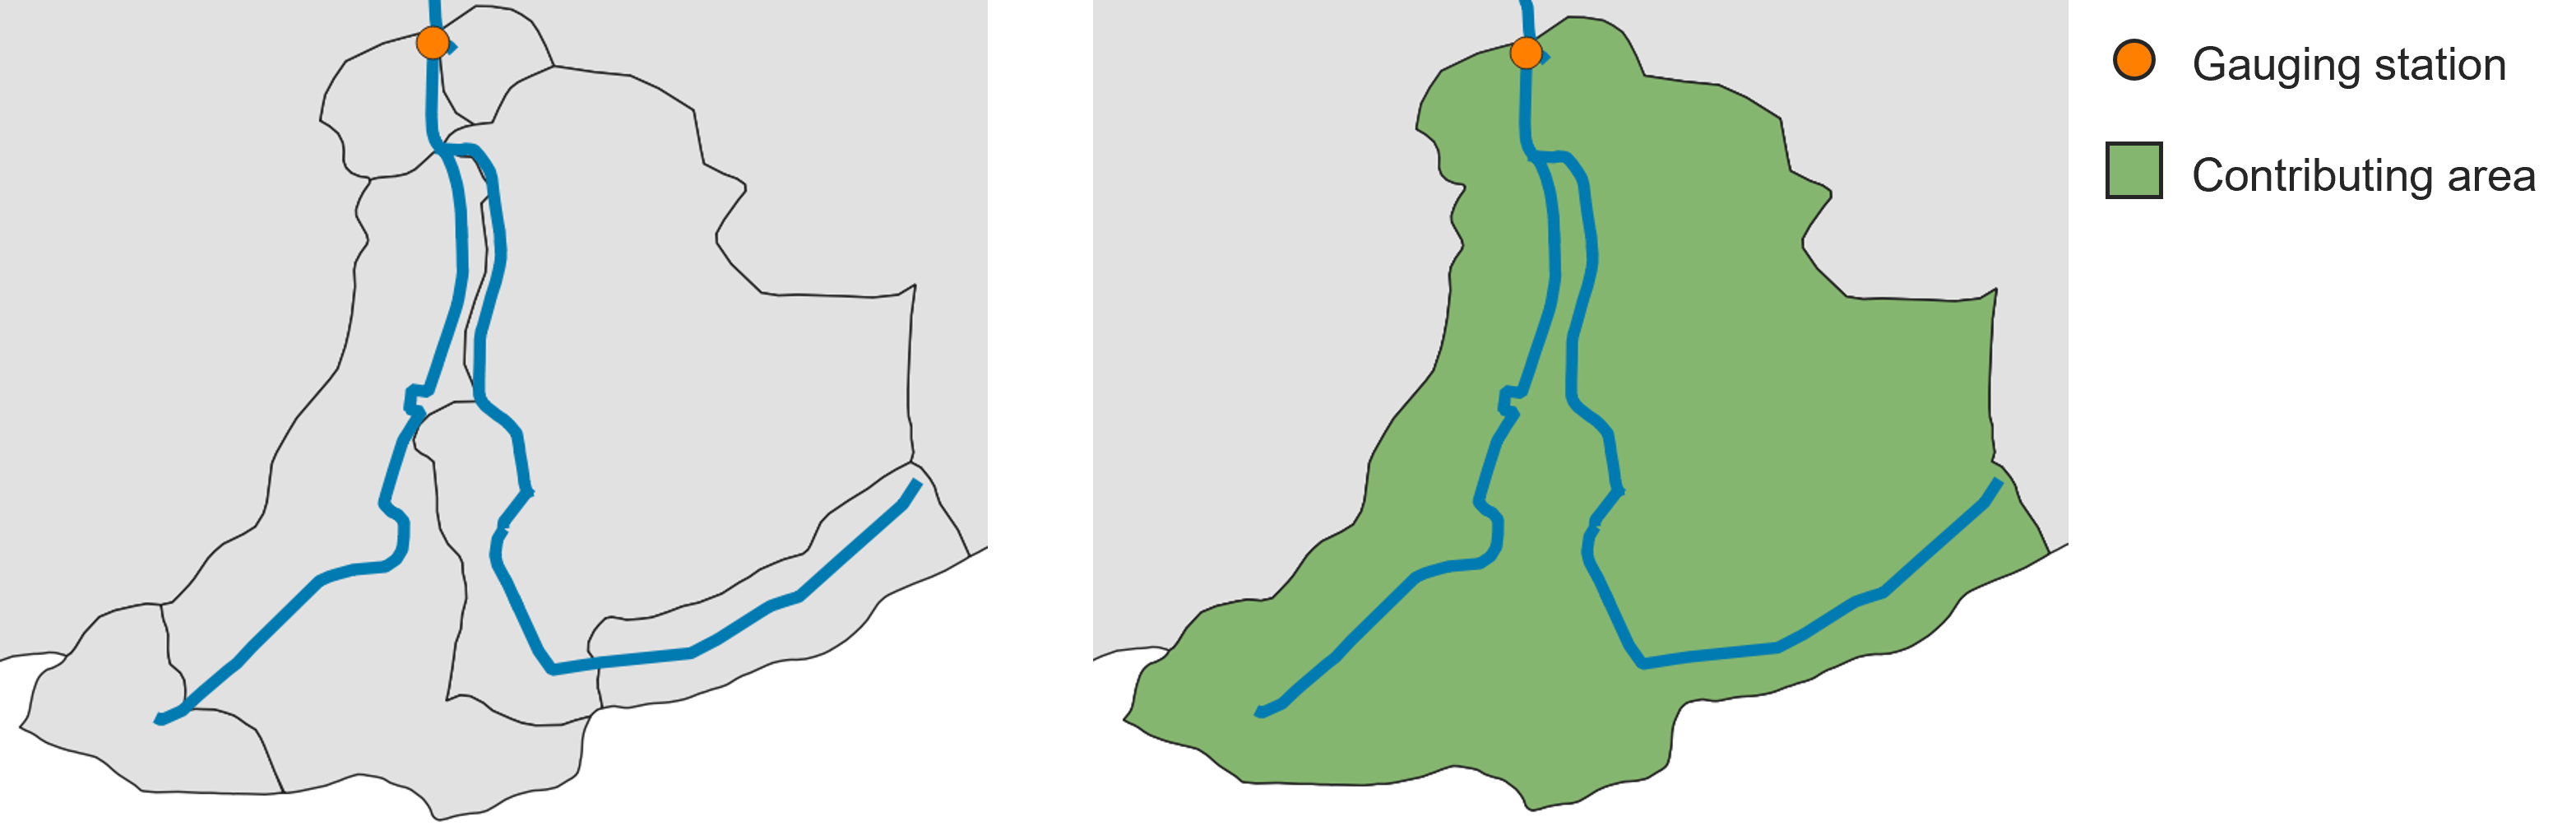
Fig. 7 On the left: a group of subcatchments with a gauging station. On the right: the contributing area of the gauging station (in green) calculated by the tool.
Input data
ungauged_subcatchments.shp (from Fix River Network)
fixed_river_network.shp (from Fix River Network)
gauging_stations.shp
The first two input data were already discussed previously, so let’s talk about the gauging_stations.shp. It is a point shapefile representing the gauging stations within the catchment. Beside the basic information (like ID, coordinates, etc.), it should contain two columns related to Mean Flow and Mean Low Flow. The two average values should be calculated over a certain time series (e.g., 1991 - 2020). In Table 1 , you can see an example of the attribute table of gauging_stations.shp.
gml_id |
Name |
Mean Flow |
Mean Low Flow |
|---|---|---|---|
ID_1974116 |
Ahrenshagen |
1.15200 |
0.2857 |
ID_1974265 |
Bützow Gesamt |
7.89810 |
1.72140 |
ID_1974124 |
Güstrow |
3.18780 |
0.6122 |
ID_1974292 |
Rostock-Geinitzbrücke |
16.00440 |
2.86670 |
ID_1974127 |
Wolken |
4.64300 |
0.8783 |
Workflow
Add all the input data to the project by clicking on “Layer –> Add Layer –> Add Vector Layer”
Go in the Processing Toolbox and look for the APRIORA plugin. Click on Hydro-Module and open 2 - Contributing Area of Gauging Station
Choose ungauged_subcatchments.shp as input for Ungauged subcatchments
Choose fixed_river_network.shp as input for Fixed river network
Choose gauging_stations.shp as input for Gauging stations
Select the Mean Flow field and Mean Low Flow field from gauging_stations.shp
Click on Run
Important
Video tutorial will follow soon.
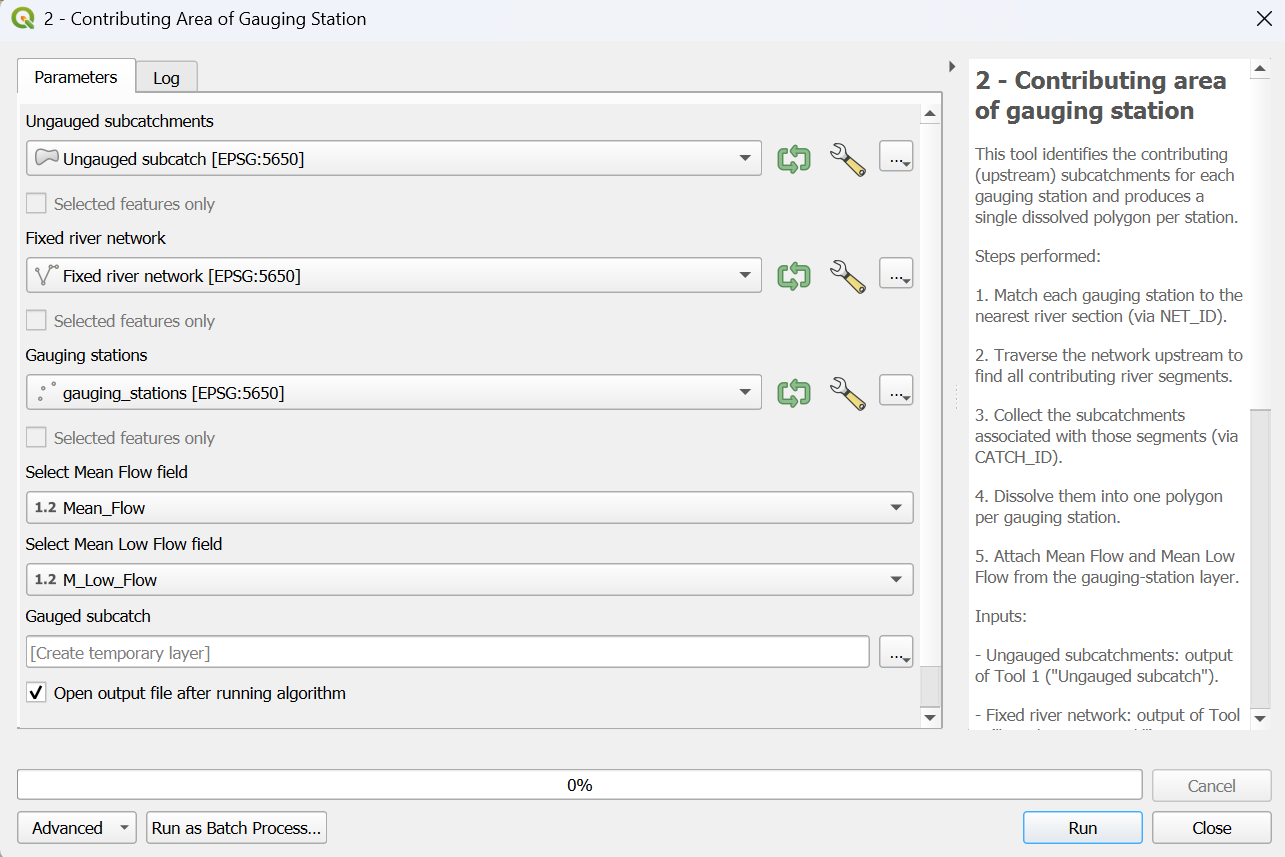
Fig. 8 Interface of the “Contributing Area of Gauging Station” window.
Output data:
gauged_subcatchments.shp
Open the attribute table of gauged_subcatchments.shp and check its features. Each feature represents the contributing area for a gauging station. If there is more than one gauging station, you will notice that the contributing areas are overlapping. If you want to highlight a specific feature, right-click on it and select Flash Feature. Important to notice: there are two extra fields called Mean_Flow and M_Low_Flow that were directly transferred from gauging_stations.shp.